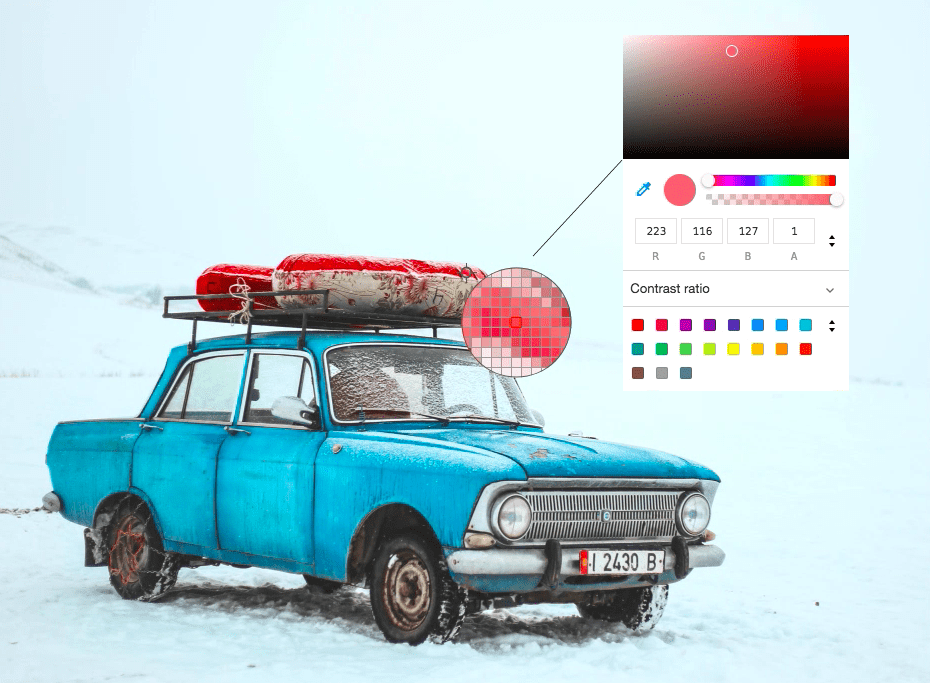
An extremely magnified image at the end is just blocks of colors called pixels, where each pixel is formed by the combination of Red, Blue and Green, our primary colors. RGB color space or RGB color system, constructs all the colors from the combination of the intensities of Red, Green and Blue colors. The red, green and …
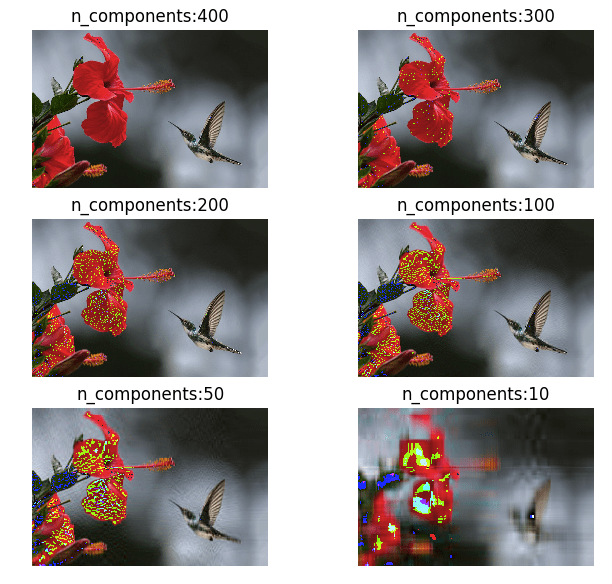
Principal component analysis is a method used to reduce the number of dimensions in a dataset without losing much information. It’s used in many fields such as face recognition and image compression, and is a common technique for finding patterns in data and also in the visualization of higher dimensional data. PCA is all about …
A Classification report is used to measure the quality of predictions from a classification algorithm. How many predictions are True and how many are False. More specifically, True Positives, False Positives, True negatives and False Negatives are used to predict the metrics of a classification report as shown below. The report is copied from our previous …
Read my previous post to understand how K-Means algorithm works. In this post I will try to run the K-Means on Iris dataset to classify our 3 classes of flowers, Iris setosa, Iris versicolor, Iris virginica (our classess) using the flowers sepal-length, sepal-width, petal-length and petal-width (our features) Getting data: import numpy as np import matplotlib.pyplot …
K-Means is one of the simplest unsupervised clustering algorithm which is used to cluster our data into K number of clusters. The algorithm iteratively assigns the data points to one of the K clusters based on how near the point is to the cluster centroid. The result of K-Means algorithm is: K number of cluster …
Support Vector machines (SVM) can be used for both classification as well as regression tasks but they are mostly used in classification applications. Some of the real world applications include Face detection, Handwriting detection, Document categorisation, SPAM Filtering, image classification and protein remote homology detection. For many researchers, SVM is the first best choice for …
Previously I wrote an article explaining the underlying maths behind polynomial regression. In this post I will use Python libraries to regress a simple dataset to see polynomial regression in action. If you want to fully understand the internals I recommend you read my previous post. Polynomial regression is a method of finding an nth …
Polynomial regression is a process of finding a polynomial function that takes the form f( x ) = c0 + c1 x + c2 x2 ⋯ cn xn where n is the degree of the polynomial and c is a set of coefficients. Through polynomial regression we try to find an nth degree polynomial function which is the closest approximation of our data points. Below is a sample random dataset which has been regressed …
Previously we built a simple linear regression model using a single explanatory variable to predict the price of pizza from its diameter. But in the real world the price of pizza cannot be entirely derived from the diameter of its base alone. It also depends on the toppings, which means there are a many more …
Previously we derived a simple linear regression modal for our Pizza price dataset. We built a modal that predicted a price of $13.68 for a 12 inch pizza. When the same modal is used to predict the price of an 8 inch pizza, we get $9.78 which is around $0.78 more than the known price of $9. …