Simple linear regression is a statistical method you can use to study relationships between two continuous (quantitative) variables: independent variable (x) – also referred to as predictor or explanatory variable dependant variable (y) – also referred to as response or outcome The goal of any regression model is to predict the value of y (dependant variable) based on the …
I am using Python’s Pillow library for image creation.You can even install it using pip. $ pip install Pillow You can get the detailed installation instructions here. Instagram’s default post size is 612px 612px so first let me create a 612px square white box. from PIL import Image, ImageDraw #variables for image size x1 = …

A famous talk by Charlie Munger at USC Business School in 1994 entitled A Lesson on Elementary Worldly Wisdom. I’m going to play a minor trick on you today because the subject of my talk is the art of stock picking as a subdivision of the art of worldly wisdom. That enables me to start …
I have read a lot of books on Calculus but “Calculus Made Easy” by Silvanus P. Thompson stands out as possibly the easiest book to read on this topic. It totally lives up to its name. The first chapter opens up with an impressive introduction on the difference between dx & ∫. d which merely means …
Binomial distribution is used to understand the probability of a particular outcome in repeated independent trials. The probability of a trial is either success or failure. The trials are independent as the outcome or the previous trial had no effect on the next trial, as happens in tossing of coins. If we flip a coin, it would either …
A Poisson distribution is the probability distribution of independent occurrences in an interval. Poisson distribution is used for count-based distributions where these events happen with a known average rate and independently of the time since the last event. For example, If the average number of cars that cross a particular street in a day is 25, …
A,B,C,D and E are vertices AB, BC, CD etc are edges the whole diagram is called a graph. The degree of a vertex is the number of edges with that vertex as an end-point; B is degree 2, written as deg(B) Graphs with no loops or multiple edges, such as the graph in 1, are called …
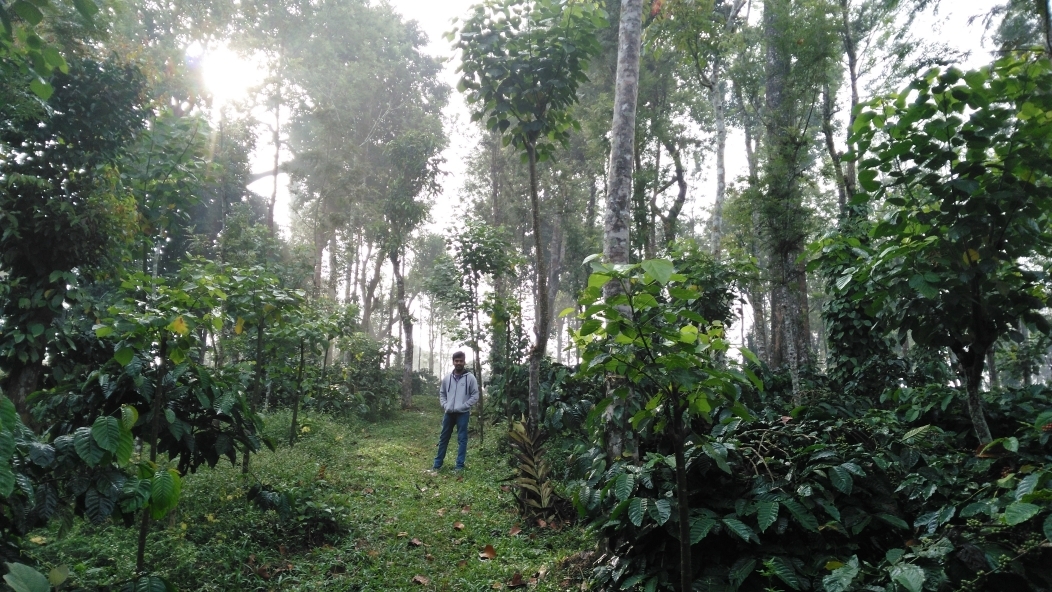
As you travel solo, being totally responsible for yourself, it’s inevitable that you will discover just how capable you are. I discovered a part of me I never knew existed when I had to confront everything that was out of my comfort zone. Like everyone who has ever received advice on traveling somewhere alone, I …
Like I always believed, there is a way to represent each and every natural language sentence using mathematical notations. Its been an year since I have been playing around with various AI algorithms and after countless failed attempts today I made some progress. A sentence can be divided into three parts as explained in Subject-Verb-Object. So a good AI who …
Markow chain is a probabilistic process used to predict the next step based on the probabilities of the existing related states. Its called a chain because the probability of the next step is dependant on the other steps in the group. For example, if the weather is cloudy then its highly likely that it might rain (The next …