A Poisson distribution is the probability distribution of independent occurrences in an interval. Poisson distribution is used for count-based distributions where these events happen with a known average rate and independently of the time since the last event. For example, If the average number of cars that cross a particular street in a day is 25, then you can find the probability of 28 cars passing the street using the poisson formula given by.

e is the base of natural logarithms (2.7183)
μ is the mean number of occurrences (25 in this case)
x is the number of occurrences in question (28 in this case)
At any day we can see 0,1,2,3,….25.. 30.. numbers on cars on the street with an average of around 25 cars. So to find 28 cars we would have to calculate
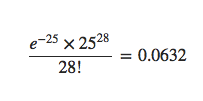
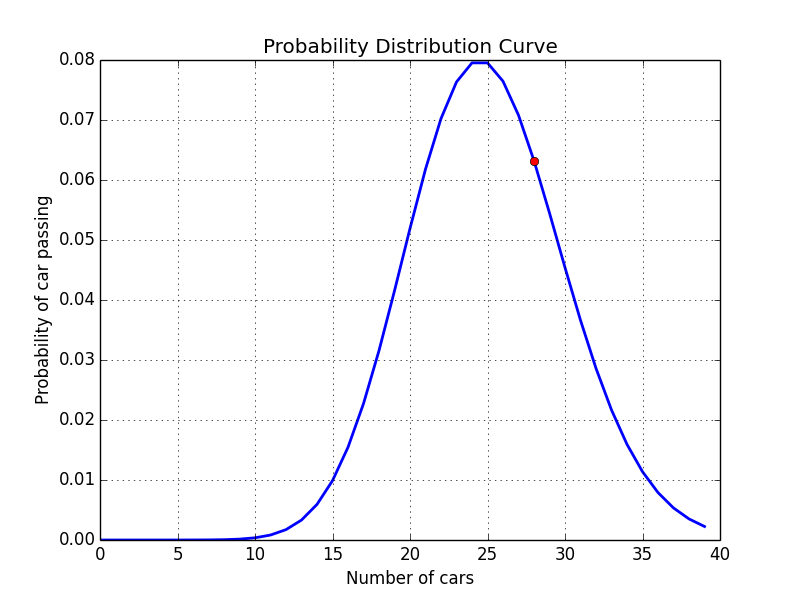
With the Poisson function, we define the mean value, which is 25 cars. The python function gives the probability, which is around (0.0632) 6%, that 28 cars will pass the street.
The formula may seem complicated to solve through hands but with python libraries its a piece of cake.
from scipy.stats import poisson
import matplotlib.pyplot as plt
plt.ylabel('Probability of car passing')
plt.xlabel('Number of cars')
plt.title('Probability Distribution Curve')
arr = []
rv = poisson(25)
for num in range(0,40):
 arr.append(rv.pmf(num))

# print(rv.pmf(28))
prob = rv.pmf(28)
plt.grid(True)
plt.plot(arr, linewidth=2.0)
plt.plot([28], [prob], marker='o', markersize=6, color="red")
plt.show()
The output plot:
References:
https://www.umass.edu/wsp/resources/poisson/
http://matplotlib.org/users/pyplot_tutorial.html