Simple linear regression is a statistical method you can use to study relationships between two continuous (quantitative) variables:
- independent variable (x) – also referred to as predictor or explanatory variable
- dependant variable (y) – also referred to as response or outcome
The goal of any regression model is to predict the value of y (dependant variable) based on the value of x (independent variable). In case of linear regression we would be using past relationships between x and y (which we call our training data) to find a linear equation of type Y = B + Ax and then use this equation to make predictions.
Lets get started with a simple example and build our linear regression model with it. Suppose you visit a pizza restaurant whose menu looks somewhat like this:
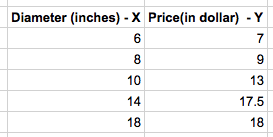
You would like to know the approximate price of your pizza if it were 12 inches in diameter. Its not there in the menu but with a linear regression model you might be able to find it. The above table is called our training set, because this is what we would use to model the relationship between diameter and the price of pizza. The training set when plotted on a graph looks like this:
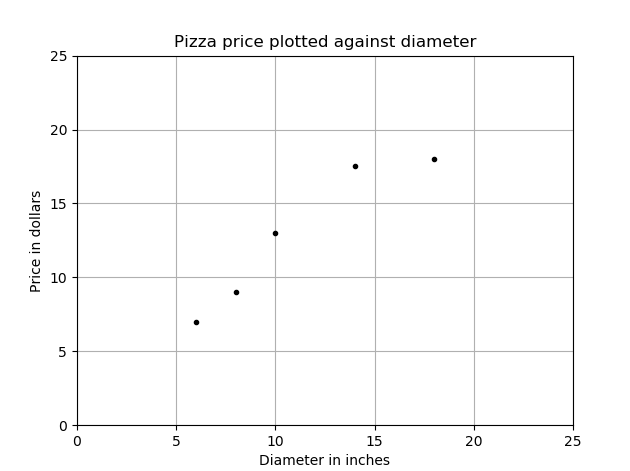
Note that the observed (x, y) data points fall somewhat in a line but not exactly straight. We will be using these data points to find an equation of a straight line which passes through all the observations which we call a linear relationship between diameter and price.
What is a Linear Regression Equation?
A linear regression equation takes the same form as the equation of a line and is often written in the following general form: y = A + Bx
Where ‘x’ is the independent variable (the diameter) and ‘y’ is the dependent variable (the predicted price). The letters ‘A’ and ‘B’ represent constants that describe the y-axis intercept and the slope of the line. To find the equation of line, we would need to use the below formula to get A and B.
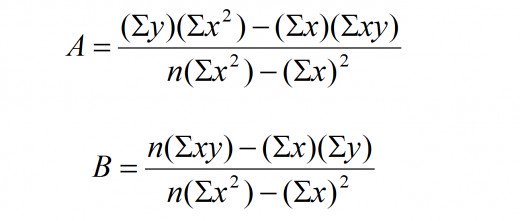
Lets do the math in an excel sheet for now and find the values of A and B.
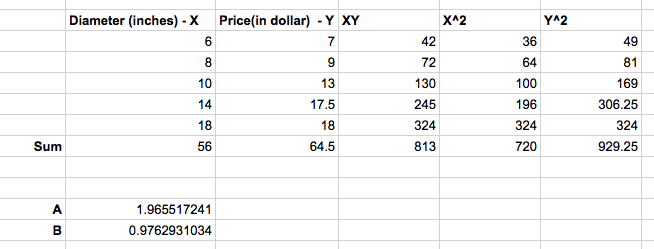
Our line equation becomes Y = 1.965517241 + 0.9762931034X. So, the approximate price of pizza when the diameter is 12 inches is around $13.68 (rounded off)
The plot of the above equation on our previous graph now looks something like this:
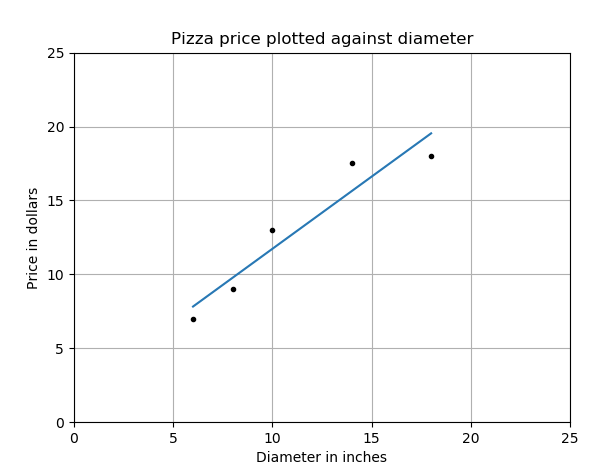
The blue line represents our linear regression model line and the dots the training data set.
Using training data to learn the values of the parameters for simple linear regression that produce the best fitting model is called ordinary least squares or linear least squares. We will discuss more about evaluating the fitness of a model with cost functions in our next article.
Python program showing the actual mathematics of Linear Regression:
import numpy as np

#Training Data set
x = [6, 8, 10, 14, 18]
y = [7, 9, 13, 17.5, 18]

#find sum(x) , sum(y) , sum (xy), sum(x*x) sum(y*y)
sum_x = np.sum(x)
sum_y = np.sum(y)
sum_xy = np.sum(np.multiply(x,y))
sum_xx = np.sum(np.multiply(x,x))
sum_yy = np.sum(np.multiply(y,y))

#print sum_x, sum_y,sum_xx, sum_xy, sum_yy

# #find the intercept values in the slope equation (Y = A + BX)
number_of_records = len(x)
A = (sum_y*sum_xx - sum_x*sum_xy)/(number_of_records*sum_xx - sum_x*sum_x)
B = (number_of_records*sum_xy - sum_x*sum_y)/(number_of_records*sum_xx - sum_x*sum_x)

#print  A, B

# find the price of pizaa (predict it)
# x = 12 inch
# y = A + BX

diameter = 12
price = A + B*diameter

print price #prints 13.6810344818
Python Program using scikit machine learning library:
from sklearn.linear_model import LinearRegression
# Training data
X = [[6], [8], [10], [14],   [18]]
y = [[7], [9], [13], [17.5], [18]]

# Create and fit the model
model = LinearRegression()
model.fit(X, y)

print 'A 12" pizza should cost: $%.2f' % model.predict(12)[0]
#A 12" pizza should cost: $13.68
Some examples of real world use of Linear Regression :
- The number of calories burnt versus the number of miles you run.
- The amount of electricity that is needed to run a house based on the size of the house.
- Height and weight relationship, As height increases, you’d expect the weight to increase, but not perfectly.
- Amount of alcohol consumed and the amount of alcohol in your bloodstream.