
This article presents a method for reducing the number of colors in an image using K-means clustering. This is a continuation of my previously posted color quantization using Uniform Quantization and Median Cut Quantization.
K-Means is one of the simplest unsupervised clustering algorithm used to cluster data into K clusters. The algorithm iteratively assigns the data points to one of the K clusters based on how near the point is to the cluster’s centroid.
In the case of color clustering, since our pixels are just 3-dimensional coordinates containing Red, Green, and Blue color space values, we can easily use the K-Means on this 3D coordinate system to find the required number of clusters. To understand more in detail about K-means algorithm, you can read my article here.
Introduction
If you have a set of data points 2D or 3D in a coordinate system, you can find the distance between any 2 data points using the euclidean distance formula given by:
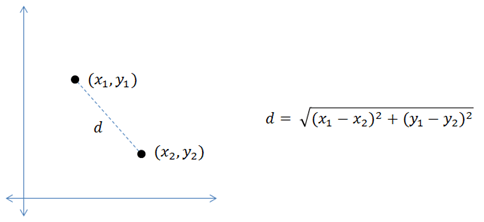
R,G,B values of an image can also be represented as 3 Dimensional points on a coordinate system, with values ranging between 0-255 for each color space. The Euclidean distance (d) between any 2 color pixels is given by:
In K-Means algorithm, we select K random pixels on the image. Then find the Euclidean distance of each pixel in the image with the identified K points (also the cluster centroids). Assign each data point to the closest centroid using the distance found in the previous step. Find the new centroid by taking the average of the points in each cluster group. Keep repeating this process until the centroid doesn’t change any more. Finally, change the color value of each pixel in the image to its centroid.
Algorithm
For our quantization, we will be using the standard K-Means algorithm implementation provided in sklearn library. The steps are as below:
- Reshape the image array with shape RxCx3 to an Nx3 array where N=RxC.
- Fit the array in K-Means method with cluster count equal to the number of colors required.
- Once the fitting is done, replace the colors in the image with the identified centroids values.
Implementation
The entire notebook can be found here. The code snippet doing the color quantization part is given below:
import numpy as np
from sklearn.cluster import KMeans
from skimage.io import imread, imsave

n_colors = 10

sample_img = imread('resources/girl.jpg')
w,h,_ = sample_img.shape
sample_img = sample_img.reshape(w*h,3)
kmeans = KMeans(n_clusters=n_colors, random_state=0).fit(sample_img)

# find out which cluster each pixel belongs to.
labels = kmeans.predict(sample_img)

# the cluster centroids is our color palette
identified_palette = np.array(kmeans.cluster_centers_).astype(int)

# recolor the entire image
recolored_img = np.copy(sample_img)
for index in range(len(recolored_img)):
    recolored_img[index] = identified_palette[labels[index]]

# reshape for display
recolored_img = recolored_img.reshape(w,h,3)

imsave('kmeans_color_q.jpg', recolored_img)
The output from the above implementation:


References:
https://scikit-learn.org/stable/modules/generated/sklearn.cluster.KMeans.html