
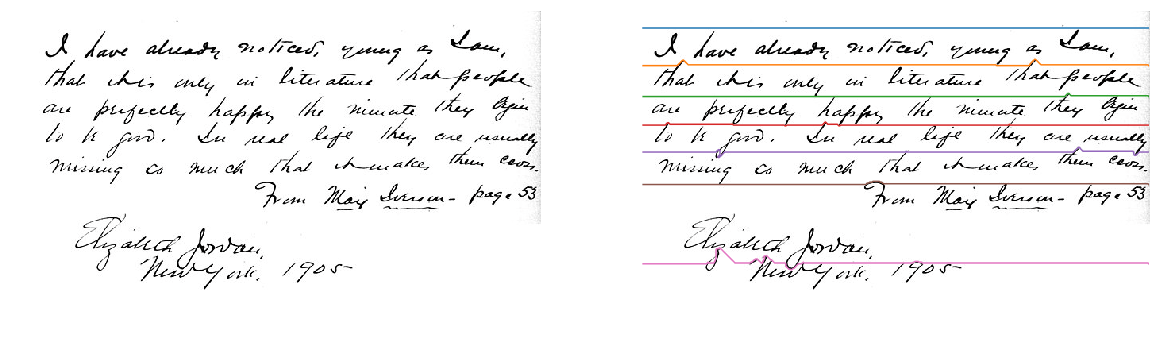
In this article, I will explain a widely used method for segmenting handwritten documents into individual lines. Below is a sample output from my algorithm.
The below flowchart outlines the different steps involved in the segmentation process.
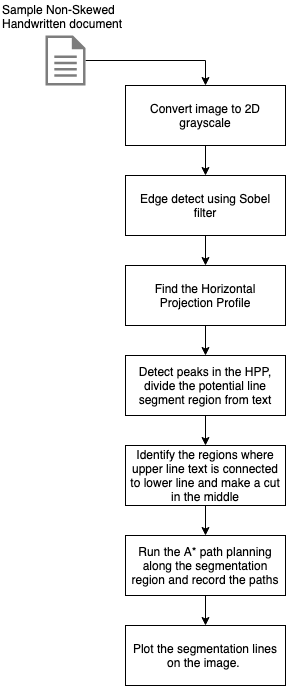
The explained method will only work with non-skewed documents. To de-skew the document, you can refer to my last article.
Now, coming to the process, let’s go step by step and understand the various stages of line segmentation. You can also see my fully working notebook here if you would like to learn it through code. If you read this article, you will be able to understand the thought process which will help you build upon my code for a much accurate line segmentation algorithm.
To walk through the algorithm steps, let’s consider the below sample image :

Step 1: Convert the image to 2D grayscale.
Default first step for almost all document pre-processing is to convert it first to grayscale so we can work on a 2 Dimensional image.
from skimage.io import imread
from skimage.color import rgb2gray
import matplotlib.pyplot as plt

img = rgb2gray(imread("handwritten1.jpg"))
plt.figure(figsize=(10,10))
plt.axis("off")
plt.imshow(img, cmap="gray")
plt.show()
Step 2: Apply an Edge detection algorithm to find the bare bones that make up the image.
I am using the Sobel filter to find edges in my sample image. You can find a detailed explanation of this filter in my previous article here.
from skimage.filters import sobel
sobel_image = sobel(img)
plt.figure(figsize=(20,20))
plt.axis("off")
plt.imshow(sobel_image, cmap="gray")
plt.show()
Step 3: Find the Horizontal Projection Profile
One of the common ways of finding the line-height of a document is by analyzing its Horizontal projection profile. Horizontal projection profile (HPP) is the array of the sum of rows of a 2D image. Where there are texts we see more peaks and the more white regions have a lower row sum. These peaks give us an idea of where the segmentation between two lines can be done.
from skimage.filters import sobel
import numpy as np

def horizontal_projections(sobel_image):
    #threshold the image.
    sum_of_rows = []
    for row in range(sobel_image.shape[0]-1):
        sum_of_rows.append(np.sum(sobel_image[row,:]))

    return sum_of_rows

sobel_image = sobel(img)
hpp = horizontal_projections(sobel_image)
plt.plot(hpp)
plt.show()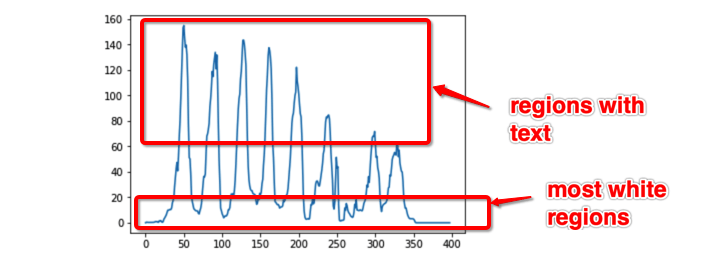
Step 4: Detect peaks in the HPP, divide the potential line segment regions from text
def find_peak_regions(hpp, divider=2):
    threshold = (np.max(hpp)-np.min(hpp))/divider
    peaks = []
    peaks_index = []
    for i, hppv in enumerate(hpp):
        if hppv < threshold:
            peaks.append([i, hppv])
    return peaks
The “divider” parameter in the above method defaults to 2, which means I will be thresholding my regions in the middle of higher and lower peaks in the HPP. This parameter is very important as this one completely changes my final segments. Finding the best divider parameter is an algorithm by itself which I will work on in my further research. Now for simplicity sake, I will be using the midpoint. If you are trying out with other sample images and fail to get good results, you can modify this parameter for better segments.

Step 5: Identify the regions where upper line text is connected to the lower line and make a cut in the middle
Take a look at the below portion of another sample image, where the white upper line is connected to the lower line.
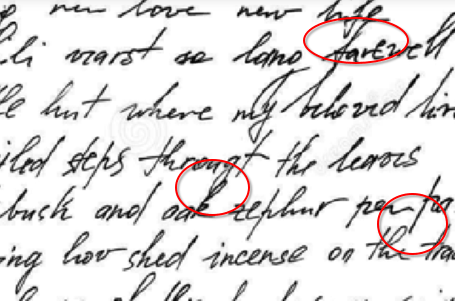
This creates a problem while segmenting the upper and lowers lines. In this step, I try to identify these regions and put a cut in between them. This is another area which can be improved significantly with better algorithms to avoid losing information about the cut letters. In my algorithm, I call them the roadblocked regions. In the method I run a window of size 20 and see if I can pass through to the other end, if yes, then I ignore it else I store the blocked window.
def get_road_block_regions(nmap):
    road_blocks = []
    needtobreak = False

    for col in range(nmap.shape[1]):
        start = col
        end = col+20
        if end > nmap.shape[1]-1:
            end = nmap.shape[1]-1
            needtobreak = True

        if path_exists(nmap[:, start:end]) == False:
            road_blocks.append(col)

        if needtobreak == True:
            break

    return road_blocks
Step 6: Run the A* path planning along the segmentation region and record the paths
A* search algorithm is a fast pathfinding algorithm to find the shortest distance between two points on a coordinate space invented by researchers working on Shakey the Robot’s path planning. Take a look at the below gif showing how it proceeds to reach the end point avoiding blocks.
To get a deeper understanding of A* star algorithm, I recommend this youtube video.
#a star path planning algorithm
from heapq import *

def heuristic(a, b):
    return (b[0] - a[0]) ** 2 + (b[1] - a[1]) ** 2

def astar(array, start, goal):

    neighbors = [(0,1),(0,-1),(1,0),(-1,0),(1,1),(1,-1),(-1,1),(-1,-1)]
    close_set = set()
    came_from = {}
    gscore = {start:0}
    fscore = {start:heuristic(start, goal)}
    oheap = []

    heappush(oheap, (fscore[start], start))

    while oheap:

        current = heappop(oheap)[1]

        if current == goal:
            data = []
            while current in came_from:
                data.append(current)
                current = came_from[current]
            return data

        close_set.add(current)
        for i, j in neighbors:
            neighbor = current[0] + i, current[1] + j
            tentative_g_score = gscore[current] + heuristic(current, neighbor)
            if 0 <= neighbor[0] < array.shape[0]:
                if 0 <= neighbor[1] < array.shape[1]:
                    if array[neighbor[0]][neighbor[1]] == 1:
                        continue
                else:
                    # array bound y walls
                    continue
            else:
                # array bound x walls
                continue

            if neighbor in close_set and tentative_g_score >= gscore.get(neighbor, 0):
                continue

            if  tentative_g_score < gscore.get(neighbor, 0) or neighbor not in [i[1]for i in oheap]:
                came_from[neighbor] = current
                gscore[neighbor] = tentative_g_score
                fscore[neighbor] = tentative_g_score + heuristic(neighbor, goal)
                heappush(oheap, (fscore[neighbor], neighbor))

    return []
The blue line in the below image is the path the algorithm finds between, start and end points.
Step 6: Plot the segmentation lines on the image.
Once you have found all the paths separating the lines, you can plot them on the image or use it to extract the lines.
Here is the latest python notebook.