A classification report is used to measure the quality of predictions from a classification algorithm. It details how many predictions are true and how many are false. More specifically, true positives, false positives, true negatives, and false negatives are used to calculate the metrics of a classification report, as shown below.
The report is copied from our previous post related to K-Means on Iris Dataset.
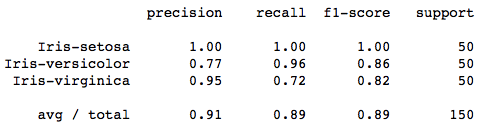
The code to generate a report similar to the one above is:
from sklearn.metrics import classification_report
target_names = ['Iris-setosa', 'Iris-versicolor', 'Iris-virginica']
print(classification_report(irisdata['Class'],kmeans.labels_,target_names=target_names))
The report presents the main classification metrics—precision, recall, and F1-score—for each class. These metrics are calculated using true and false positives, along with true and false negatives. In this context, “positive” and “negative” are simply generic terms used for the predicted classes.
To assess whether a prediction is correct or incorrect, we consider four possible outcomes:
- TN / True Negative: The model correctly predicts a negative class for a negative case.
- TP / True Positive: The model correctly predicts a positive class for a positive case.
- FN / False Negative: The model incorrectly predicts a negative class for a positive case.
- FP / False Positive: The model incorrectly predicts a positive class for a negative case.
For example, if you were explaining the classification metrics for spam filtering. True positives are correctly identified spam emails sent to the spam folder (TP), while true negatives are legitimate emails delivered to the inbox (TN). False positives are mistakenly flagged spam emails that actually belonged in the inbox (FP), and false negatives are missed spam emails that got through to the inbox (FN).
Precision – What percent of your predictions were correct?
Precision is the ability of a classifier not to label an instance positive that is actually negative. For each class it is defined as the ratio of true positives to the sum of true and false positives.
Precision – Accuracy of positive predictions.
\(Precision = \frac{\text{True Positives (TP)}}{\text{(True Positives (TP)+ False Positives (FP))}} \)
from sklearn.metrics import precision_score

print("Precision score: {}".format(precision_score(y_true,y_pred)))
Recall – What percent of the positive cases did you catch?
Recall is the ability of a classifier to find all positive instances. For each class it is defined as the ratio of true positives to the sum of true positives and false negatives.
Recall: Fraction of positives that were correctly identified.
\(Recall = \frac{\text{True Positives (TP)}}{\text{True Positives (TP) + False Negatives (FN)}} \)
from sklearn.metrics import recall_score
print("Recall score: {}".format(recall_score(y_true,y_pred)))
F1 score – What percent of positive predictions were correct?
The F1 score is a weighted harmonic mean of precision and recall such that the best score is 1.0 and the worst is 0.0. Generally speaking, F1 scores are lower than accuracy measures as they embed precision and recall into their computation. As a rule of thumb, the weighted average of F1 should be used to compare classifier models, not global accuracy.
\(F_1 = \frac{2 \times \text{Precision} \times \text{Recall}}{(\text{Precision} + \text{Recall})} \)
from sklearn.metrics import f1_score
print("F1 Score: {}".format(f1_score(y_true,y_pred)))