Read my previous post to understand how K-Means algorithm works. In this post I will try to run the K-Means on Iris dataset to classify our 3 classes of flowers, Iris setosa, Iris versicolor, Iris virginica (our classess) using the flowers sepal-length, sepal-width, petal-length and petal-width (our features)
Getting data:
import numpy as np
import matplotlib.pyplot as plt
import pandas as pd

url = "https://archive.ics.uci.edu/ml/machine-learning-databases/iris/iris.data"
#the imported dataset does not have the required column names so lets add it
colnames = ['sepal-length', 'sepal-width', 'petal-length', 'petal-width', 'Class']
irisdata = pd.read_csv(url, names=colnames)
describe the data:
irisdata.head()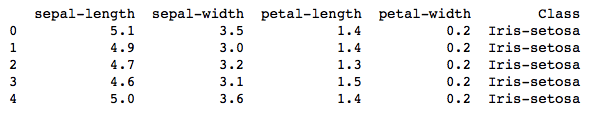
Converting the class names into numerical categories for analysis.
irisdata['Class'] = pd.Categorical(irisdata["Class"])
irisdata["Class"] = irisdata["Class"].cat.codes
Preparing our dataset:
X = irisdata.values[:, 0:4]
y = irisdata.values[:, 4]
Running K-Means on it:
from sklearn.cluster import KMeans

# Number of clusters
kmeans = KMeans(n_clusters=3)
# Fitting the input data
kmeans = kmeans.fit(X)
# Getting the cluster labels
labels = kmeans.predict(X)
# Centroid values
centroids = kmeans.cluster_centers_
Checking the clustering accuracy of our program:
from sklearn.metrics import classification_report

target_names = ['Iris-setosa', 'Iris-versicolor', 'Iris-virginica']

print(classification_report(irisdata['Class'],kmeans.labels_,target_names=target_names))
The output of classification looks like this:
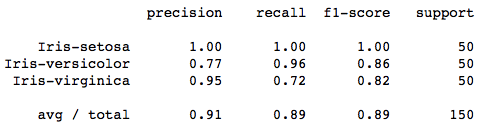
You can see in the classification report that, 91% of our data was predicted accurately. That’s pretty good for an unsupervised algorithm.