This is in continuation of my previous post about creating Bar chart, we will try to add some more features to our chart to make it look more appealing with minimal changes. List of things we will add in this version of chart.
- x-axis and y-axis labels.
- y-axis line
- Animate the bars
We will work on the same code written from our previous bar chart and make the modifications. You can check out the finished version here
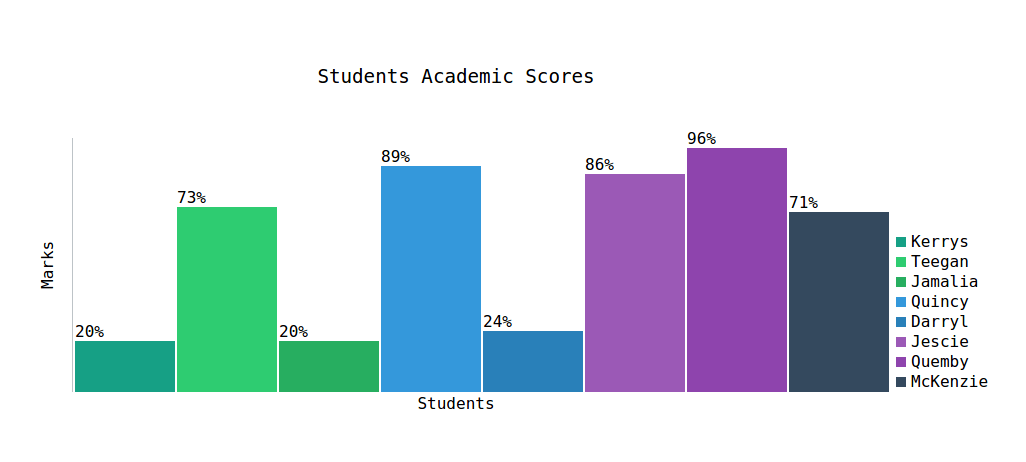
Rotate Effect: As you can see in the snapshot above that the y axis title is rotated and is aligned perfectly with the y-axis line. You can achieve that using CSS3 transformations. We are rotating the text by 270 degree.
.ytitle span {
  transform: rotate(270deg);
  -webkit-transform: rotate(270deg);
  -moz-transform: rotate(270deg);
  -o-transform: rotate(270deg);
  -ms-transform: rotate(270deg);
  writing-mode: lr-tb;
  display: block;
}
Bar Animation: If we set the height while creating the chart we may not be able to see the animation, so we need to set the heights after the chart is rendered. This way we can use the transition effect from the chart. The below CSS takes care of our animation.
.bars div {
  height:0%;
  -webkit-transition: 0.4s ease;
  -moz-transition: 0.4s ease;
  -ms-transition: 0.4s ease;
  -o-transition: 0.4s ease;
  transition: 0.4s ease;
  -webkit-transition: height 0.5s;
  -moz-transition: height 0.5s;
  -ms-transition: height 0.5s;
  -o-transition: height 0.5s;
  transition: height 0.5s;
}
The javascript used to set the values on the bar.
chart.appendChild(barchart);
//our chart is rendered
document.getElementById('chart').innerHTML = chart.outerHTML;

//now we set the bar heights
setTimeout(function(){
  for (var i = 0; i < chartjson.data.length; i++) {
    var bar = document.getElementById('bar'+i);
    bar.style.height = chartjson.data[i][chartjson.ykey] + prefix;
  }
}, 300);
I have used setTimeout to get our desired animation. You may use jquery animate to achieve the same effect but for a simple animation, I guess you don’t want to include a massive jquery library. In my next post we will try to make a directive for our chart which we will reuse to show multiple bar charts on the same page.